Barcode: visualising land-use for collaborative urban planning
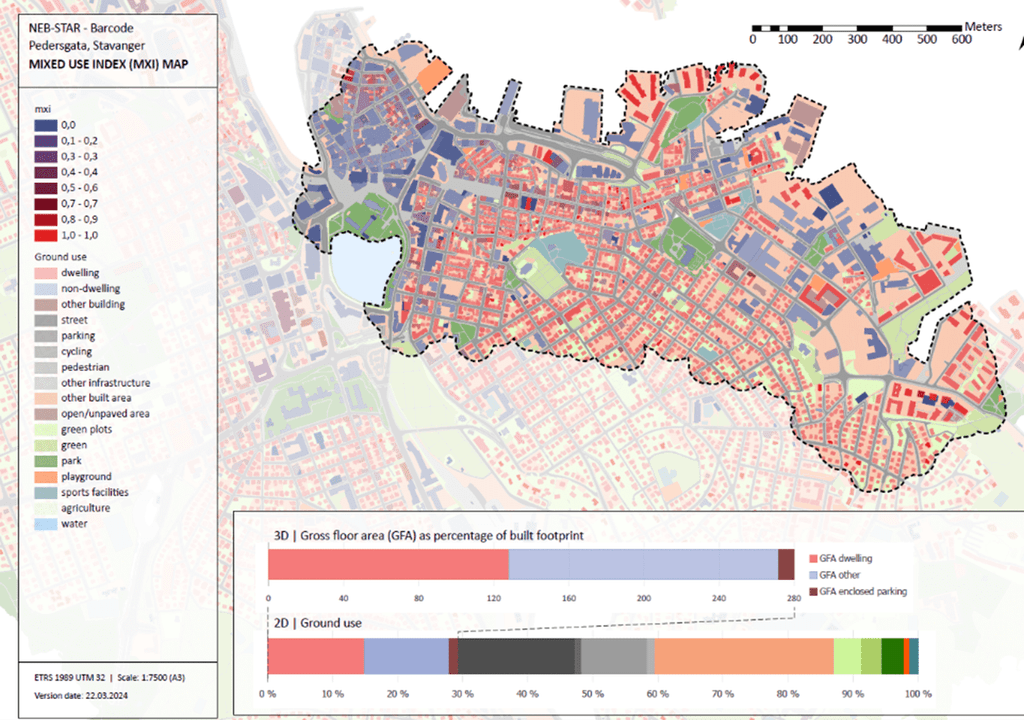
Digital maps showing how space is distributed in an area between different uses like housing, shopping, mobility, etc
Credit: NEB STAR
Credit: NEB STAR
Credit: NEB STAR
Resource
Context
Making the best use of the limited urban space available
Welcoming more inhabitants in a city means building new houses, but also services and infrastructures such as roads, paths, parks, schools, etc… in a manner that is enjoyable by inhabitants, and efficient in terms of resources and land-use.
The Barcode tool was initially developed by the municipality of Utrecht in Netherlands to support their ambition to become a 10-minute city. That is, a city where inhabitants can access essential services and meet daily needs within 10 minutes’ walk or bike ride. The idea with the tool is to visualise how each square meter of the district or city is used, so as to better plan future developments and make the best use of the space available.
The tool was tested within the NEBSTAR project by the municipalities of Prague in Czech Republic, and Stavanger in Norway. NEBSTAR is one of the first New European Bauhaus Lighthouse project funded by the European Commission.
The resource in a nutshell
A digital tool helping urban development professionals analyse and discuss land-use
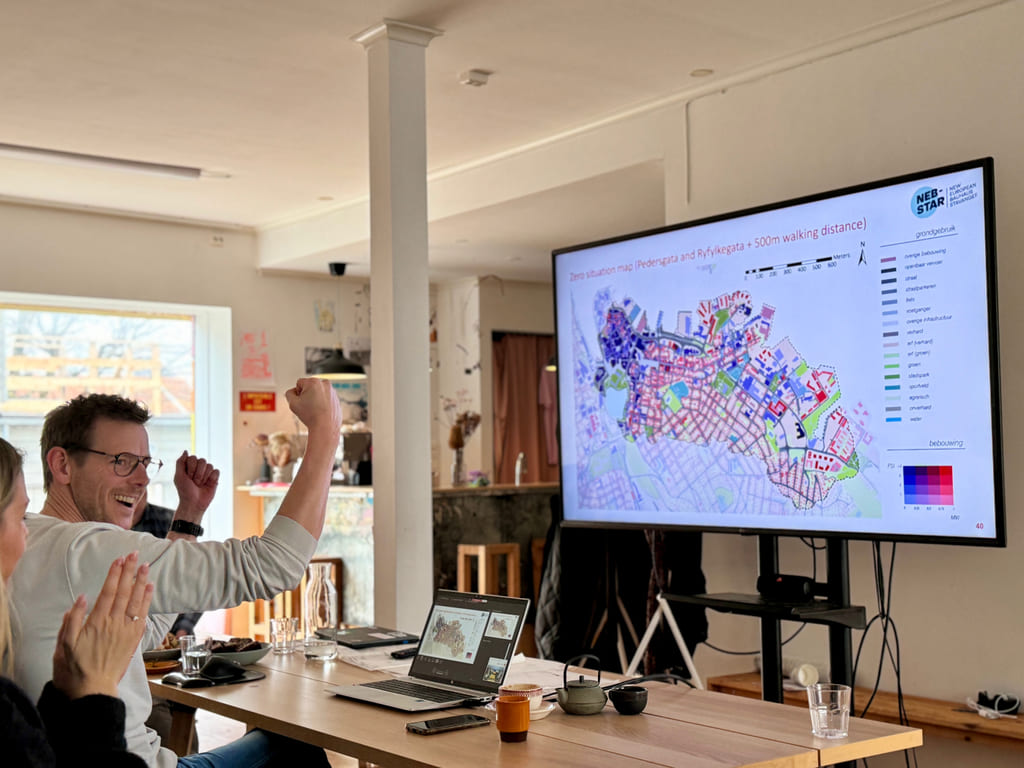
The Barcode Baseline is a digital tool for urban planners and private developers. It shows the spatial and programmatic layout of the city or a section of the city: how the public space is organised, where the buildings are located, what functions are present, etc. It utilizes various data sources to generate digital land-use maps and displays the data in a visual “barcode” format (based on Excel-files).
The tool helps get an objective picture of the area, identify which functions are over- or underrepresented, and explore different land-use options to find the right balance for its future development.
The theoretical barcode is a visual representation of the functions required to build 10,000 homes on a meadow. Based on standards for each category, it determines how many square meters must be allocated to each function to ensure balanced growth. For example, 10,000 homes imply approximately 2.5 additional elementary schools, 51 hectares of neighbourhood green space, 7,000 jobs, etc.
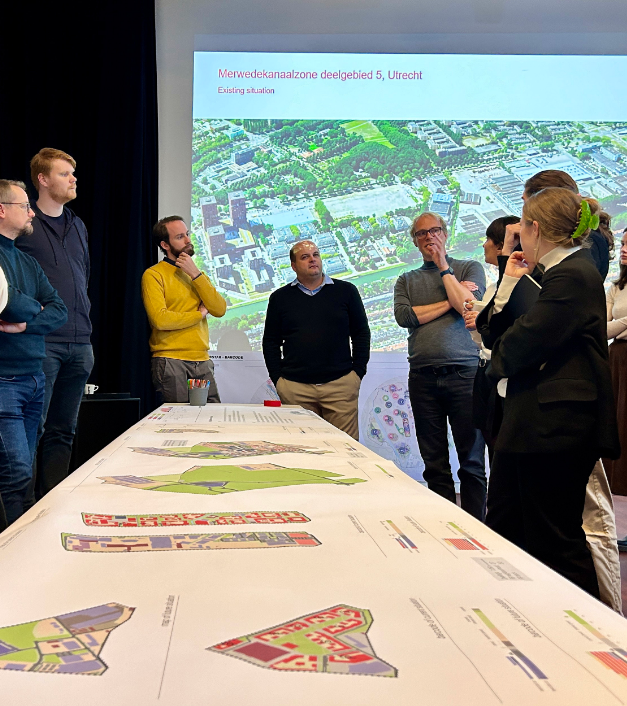
In Utrecht, the tool helped design urban development projects with high density of housing, enabling more people to live and work within a smaller area, thus reducing the need for transport and infrastructure. It also enabled the municipality to assist private developers in planning their projects so that they contribute to the area, rather than being designed as isolated plots.
The tests performed in the municipality of Stavanger (Norway) highlighted how the Barcode is a powerful communication tool that helps democratizing urban planning.
The Barcode tool was designed by the municipality of Utrecht, then further developed and tested within the NEB STAR project. It was funded by the HORIZON EUROPE programme.